Data Analysis
Data Collection #1 Part 1
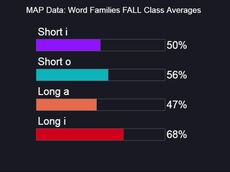
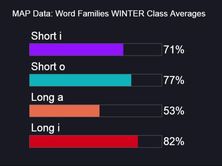
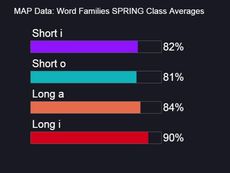
MAP (Measures of Academic Progress) Testing: Word Families
|
|
|
Each of these bar graphs reflect my class proficiency averages in the areas of short vowels and long vowels. This data was gathered from the MAP skills test, taken in the fall, winter, and spring. Explicit instruction was used in the specific areas of short vowels i and o, as well as long vowels a and o as these were the lowest scoring vowels in the fall. The first two tests were administered prior to the action plan, while the third test was administered after explicit phonics instruction in the above short and long vowels. The purple and teal bars show students' progression of growth in short vowels (i and o). The orange and red bars demonstrate student growth in long vowels (a and i). As shown above, the class averages increased by at least 4% or more between the time of pre-action plan (winter) to post action plan (spring). However, I am still wondering why there was only a 4% increase in short o vowels between winter and spring. Is this because short o is still a phonics skill that my students struggle with?
Data Collection #1 Part 2
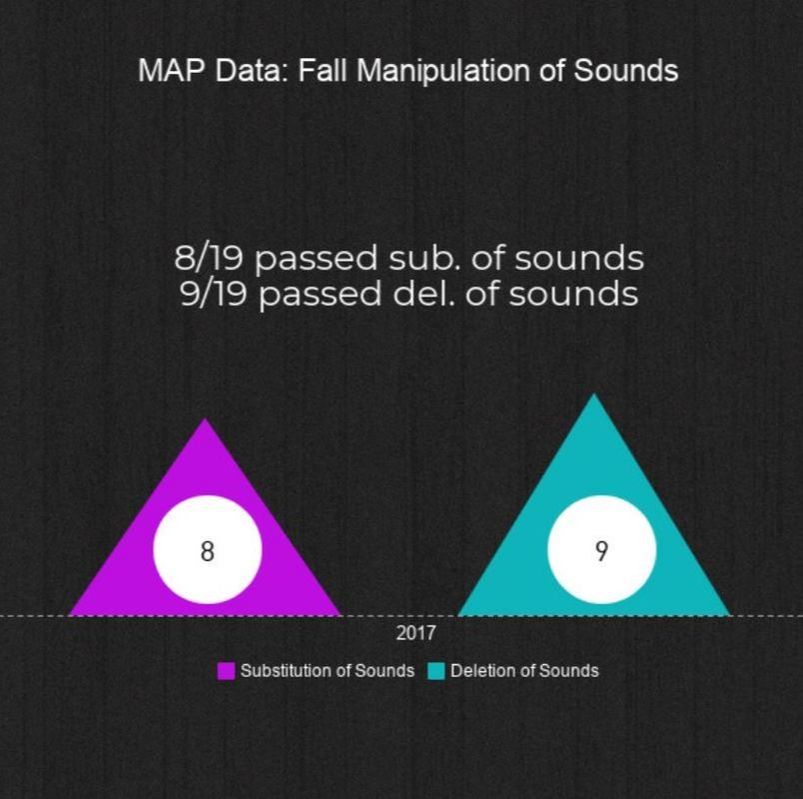
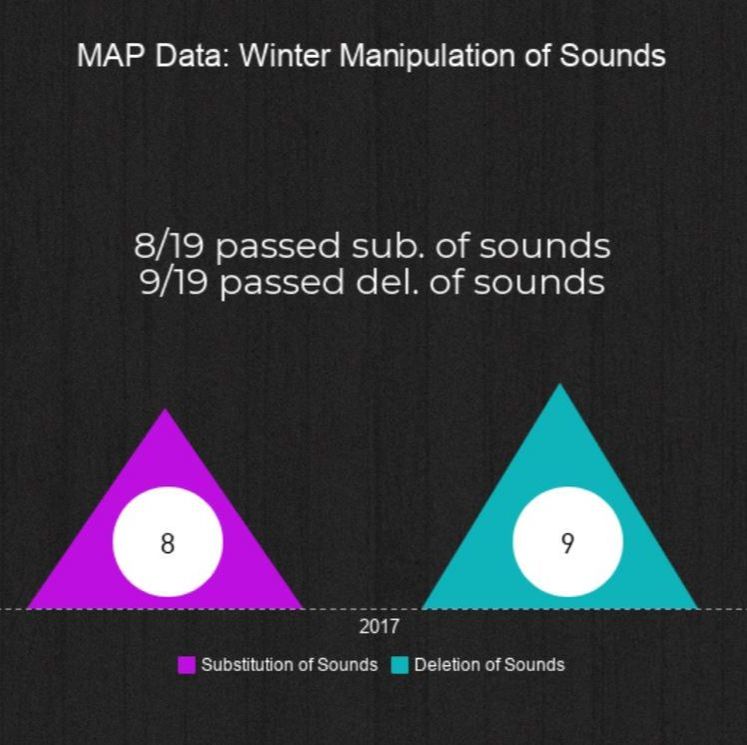
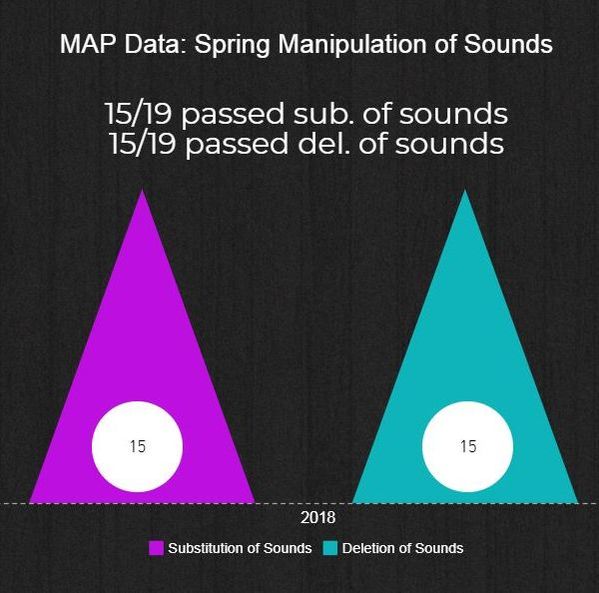
MAP (Measures of Academic Progress) Testing: Manipulation of Sounds
|
|
|
Part 2 of my MAP data collection illustrates student growth in manipulation of sounds. For this test, students had to manipulate sounds by substituting different sounds to make new words and delete sounds to make new words. As you can see from the pyramids in the fall and winter, students made zero growth in manipulation of sounds, specifically in substitution and deletion of sounds. This reiterated that my decision to implement substitution and deletion of sounds into my 7 week action plan was right on course. From the fall and winter pyramids to the spring pyramid, the number of students passing substitution of sounds went up by 7 students and the number of students passing deletion of sounds went up by 6 students. This showed major growth in manipulation of sounds from pre-action plan to post-action plan. However, in manipulation of sounds, my biggest remaining question is why was there no growth between the fall and winter? Is this because there was previously not explicit word work implementation in those months?
Data Collection #1 Part 3
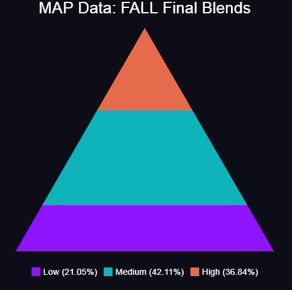
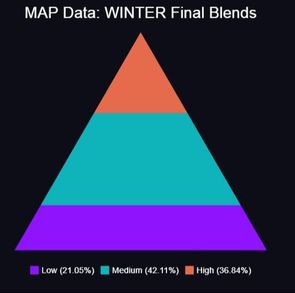
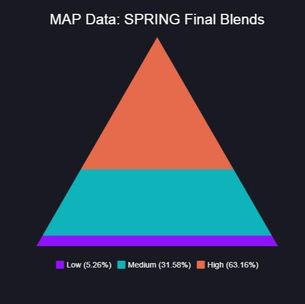
MAP (Measures of Academic Progress) Testing: Final Blends
|
|
|
The pyramids reflect student growth in the area of final blends over the course of fall, winter, and spring. Prior to being taught explicit phonics instruction, 21% of my class tested low in final blends in the fall AND winter. As you can see, my data was the exact same in the fall and winter, meaning that my students made zero growth from the time they took this test in the fall to the time they took it in the winter. The fall data provided me with a benchmark when deciding to implement explicit phonics instruction. After reviewing my winter data, my students' need for phonics instruction, specifically in the area of final blends, was once again clear.
From the winter to the spring, students grew exponentially in final blends. The percentage of low students went from 21% to 5%, the average percentage went from 42% to 31%, and the percentage of students scoring in the high percentile went from 36% to 63%.
Data Collection #2
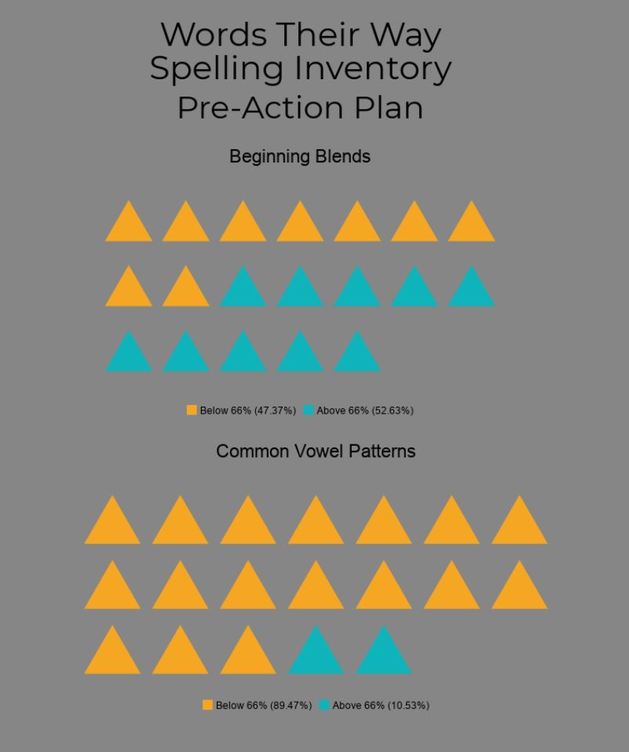
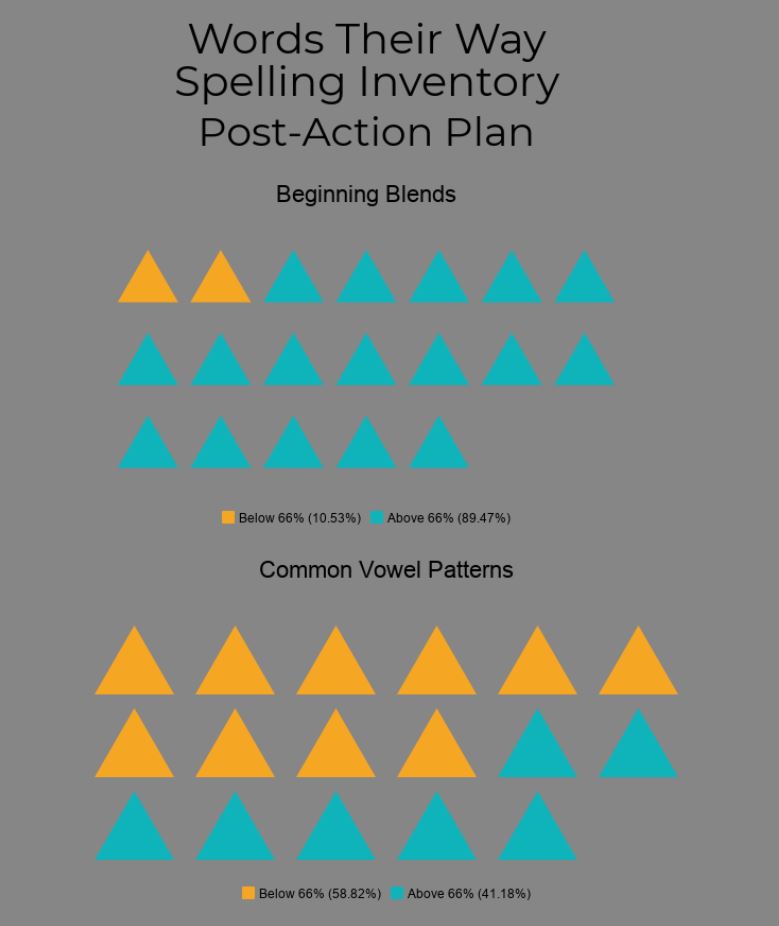
Words Their Way Spelling Inventory
|
|
The above data was taken from a Words Their Way spelling inventory given to students prior to explicit phonics instruction and following 7 weeks of explicit instruction. On this assessment, students were scored according to word parts (short vowels, long vowels, beginning blends, final blends, digraphs, and vowel patterns). Students were given points for recognizing correct word parts, although they may not have spelled the entire word correctly. For example, students who spelled "shine" as "shin" got one point for the correct digraph "sh," but would not get a point for spelling the word correctly. Points for correct word parts were determined as "feature points," in addition to points for words spelled correctly. This was an extremely beneficial assessment for me as many of my students are able to identify these word parts as they read, but not when they write. Through this assessment, I was able to distinguish specific beginning blends and word patterns that my students needed direct instruction in. From the pre-action plan to post-action plan, our class went from 52% of students scoring above a 66% in beginning blends to 89% of students scoring above a 66%. In the category of common vowel patterns (which is an early second grade stage), our class went from 10% of students scoring above a 66% to 41% of students scoring above a 66%. I continue to wonder about additional ways to increase students' knowledge in common vowel patterns. Granted, students only worked on vowel patterns for one week during my action research, but I wonder if there would have been a bigger jump if more emphasis was placed on common vowel patterns?
Data Collection #3
Running Records
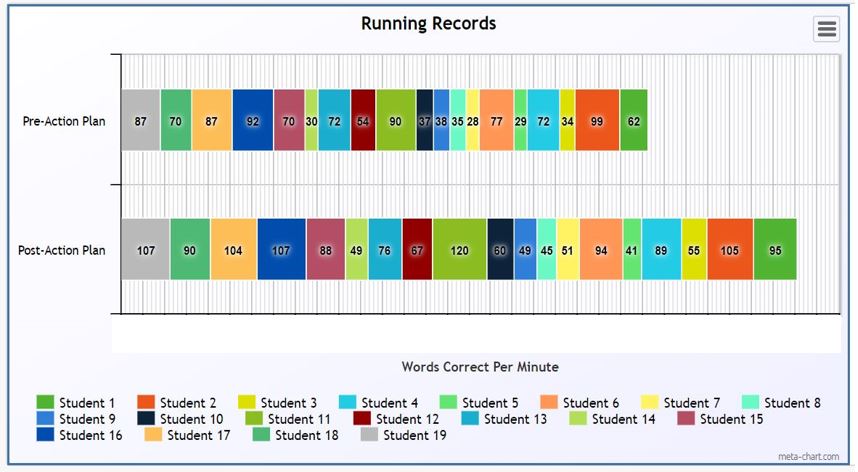
This graph shows student growth in the area of reading accuracy. Students who are knowledgeable in the area of letter-sound relationships and have awareness of phonics elements should be able to read at a higher accuracy. This means that students who can understand and identify letter-sound relationships will be able to read more words correctly. In order to test my students in the area of reading accuracy, students took part in running records. Each student was given a passage (at his/her reading level) to read prior to the 7 weeks of explicit instruction and a different passage after the 7 weeks. Students were scored based on how many words they read correctly in one minute. As you can see above, each specific color represents a specific student. The top horizontal bar represents student's score prior to phonics implementation and the bottom horizontal bar reflects students' running record score after explicit phonics instruction. According to the bar graphs, all students grew by at least 4 words per minute in those 7 weeks. Some students even increased their words per minute by 30 words! However, I wonder if the scores would have differed based on the type of passage they read (nonfiction or fiction) at the beginning and/or the end of my action research.
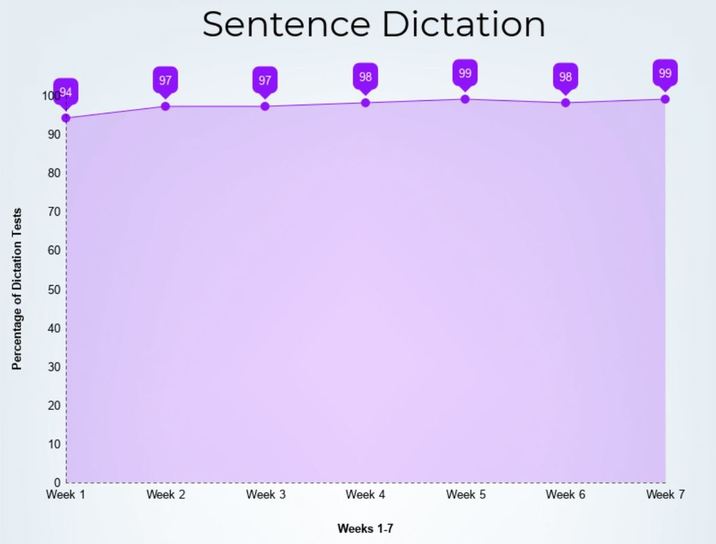
Data Collection #4
Each week of explicit phonics instruction, students were given a sentence dictation test on Friday. Each sentence was pre-planned and orally given by the teacher. The oral sentence always incorporated the phonics skill worked on that week, along with any previously practiced phonics skill. Students' sentences were then scored based on word parts. Therefore, each week, the number of possible points increased. In the first week, students were only scored in short vowels, as that was the first skill taught/practiced. The next week, students were scored on short vowels and long vowels. By the seventh week, students were scored on short vowels, long vowels, beginning blends, final blends, substitution of sounds, deletion of sounds, and common vowel partners. This method of data collection allowed me to observe student retention of each phonics skill. The y axis on the above graph represents our class average of dictation tests. Therefore, if a student got 7/7 word parts correct, he/she would get a 100% on that dictation test. His/her score would then be factored into the total class average. As presented on the graph, the data showed our sentence dictation class average was always above a 94%, with scores being above a 98% in the last four weeks. According to the above data, students were learning, understanding, and retaining phonics skills taught each week.
